
Analytics and alerts
Everything that happens in the counter app and in your surveys shows up in the web dashboard. Here you see who your best customers are, which location rates lowest and which reward is redeemed most.
The Overview
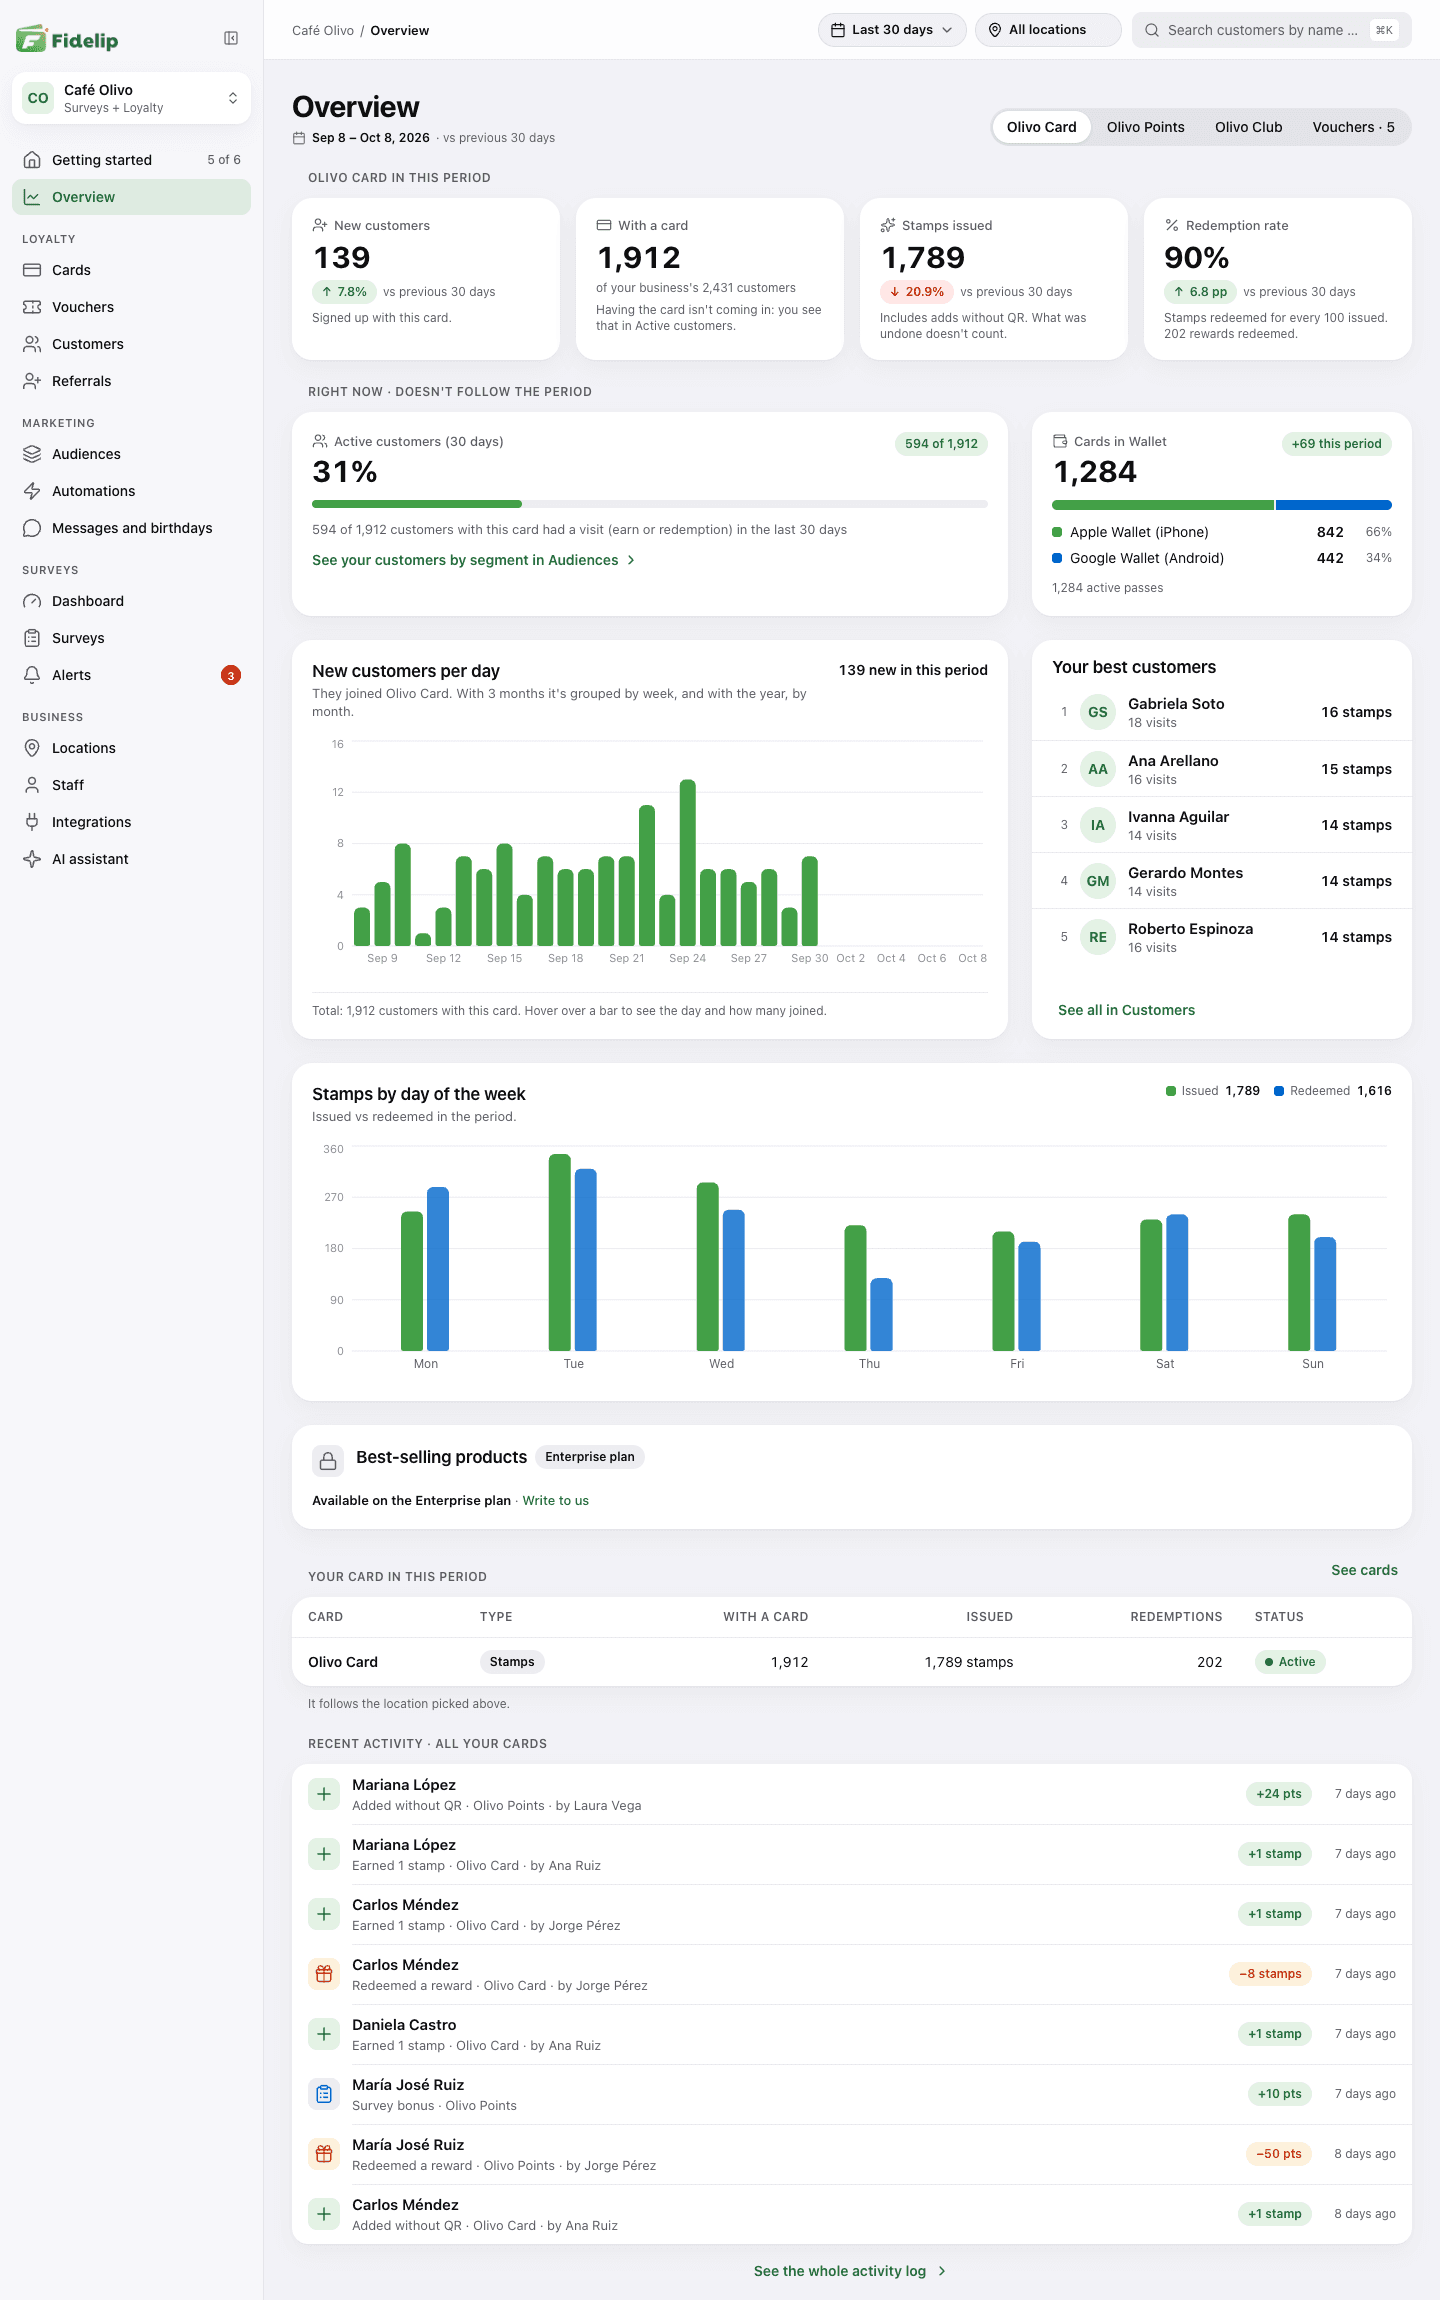
Dashboard → Overview (at app.fidelip.com) answers “how is my program doing?” On the Surveys plan, which has no Loyalty, it does not exist: your dashboard opens straight on the surveys dashboard.
Everything is shown for one card at a time: if you have more than one, you pick it under the title (on a phone, as chips under the period), and the Overview remembers your last choice in that browser. If you have vouchers, Vouchers shows up as an option too. With several locations, the All locations pill in the top bar filters everything to one of them. Stamps and points are never added together.
- Four numbers for the period: New customers (people who signed up with that card), With a card (how many hold it, out of all your business's customers), the stamps or points issued (including adds without QR; anything undone does not count) and Redemption rate (how many were redeemed for every 100 issued, with the rewards handed over underneath). New customers, issued and redemption rate are compared with the previous period (the redemption rate in percentage points). If the previous period had fewer than 5 sign-ups or fewer than 5 movements that issued stamps or points, the comparison does not show: with so little, a percentage says nothing.
- Right now · doesn't follow the period: Active customers (30 days) counts how many of your customers had a visit (an earn or a redemption) in the last 30 days. A customer who signed up and never came back, a birthday bonus or a manual adjustment does not count as a visit. It is the same count as Active (under 30 days) in Customer retention, further down. Tap the box (See your customers by segment in Audiences) to go to Dashboard → Audiences and see who they are. Next to it, Cards in Wallet: how many cards are saved, split between Apple Wallet (iPhone) and Google Wallet (Android), how many were added in the period and how many are still active.
- New customers per day: bars with the new customers per day, per week (with 3 months) or per month (with the year), depending on the length of the period, and the period's total at the top right. Hover over a bar (or tap it on a phone) to see the day and how many joined.
- Your best customers: the five who earned the most stamps or points in the period, with their visits. See all in Customers opens Dashboard → Customers.
- The chart of stamps or points by day of the week: issued vs redeemed, added up by weekday in your business's time (a sale at 11 p.m. on a Friday counts as Friday).
- Best-selling products, by revenue in the period: on the Enterprise plan, and when your point of sale sends Fidelip the products on each receipt. On other plans you see the Enterprise plan notice there.
- Recent activity · all your cards: the latest movements (8 on a computer, 5 on a phone), each with what happened, the card and who recorded it. An earn typed in without scanning the QR says Added without QR. See the whole activity log opens the activity log.
If you pick Vouchers, the Overview switches to your vouchers: how many are Sent, Active and Used or expired, along with recent activity; the charts belong to one card. A card nobody holds yet shows its numbers and an explanation, with the Go to Getting started and Download sign-up QR buttons, instead of empty charts. On a phone the Overview is the short version: the numbers, the active customers block, the new customers chart and recent activity, and More of the overview has one row for every section left out.
Period filters
The period selector is in the top bar (on a phone, under the title, with three quick choices and More for the rest). It opens on Last 30 days and supports:
- Today
- This week
- Last 2 weeks
- This month
- Last 30 days
- Last 3 months
- Year to date (compared with the same dates a year earlier)
- This year (compared with the whole previous year)
- Custom: you enter From and To and tap Apply
Days are counted in your business's time zone. All figures start on the day you opened your account, so you never see data from before you signed up: the period menu tells you since when there is data.
Your team sees a shorter summary in the Analytics tab of the Fidelip Staff app, and the alerts in its Alerts tab: see Analytics tab and Alerts tab.
Card analysis
At the bottom of the Overview, with a card picked, is its analysis. It follows the location at the top, but has its own period selector.
- Visits (earns and redemptions in the period), Visits per customer and Customers who came back (those who came more than once), plus stamps or points per customer. On a points-per-purchase card, the average ticket and an estimate of extra revenue are added: it is only an estimate.
- Customer retention: all your customers by their last visit (earn or redemption), regardless of the period you picked: Active (under 30 days), At risk (30 to 60 days), Inactive (over 60 days) and No visits yet. Below, inactive customers month by month and a link to Audiences to see who they are.
- Customer value: the Average and the Median of what each customer earned (or, on points-per-purchase cards, spent) in the period, and how many fall in each range.
- Your team in this period: who recorded how many movements, at which location, and how much they issued and redeemed.
On a phone, all of this is in the Retention and analysis row of More of the overview.
The activity log
Activity log lists every earn, redemption, bonus and adjustment on your customers' cards, newest first and grouped by your business's day: who got it, who did it and when. Filter by From and To, Customer, Who did it and Type. The customer's name opens their record, where you can undo an earn during its first 10 minutes. Because it shows customer names, only the owner and admins can see it.
PDF reports
Every card and every survey has Weekly and Monthly reports you can download as a PDF: handy for meetings or to send to the owner. The owner and admins can see them.
- For a card: in Dashboard → Cards, open the card and go to its Reports tab. At the top you see the latest period with activity: the Customers who came, the stamps or points given, the Rewards redeemed and the New customers. Below are the Available periods: open one to see its summary, with the most popular reward, and download its PDF with PDF.
- For a survey: the survey's Reports tab, or the Weekly and monthly reports row in Dashboard → Surveys → Dashboard. It brings the responses, NPS, alerts and new customers of each period.
Survey alerts
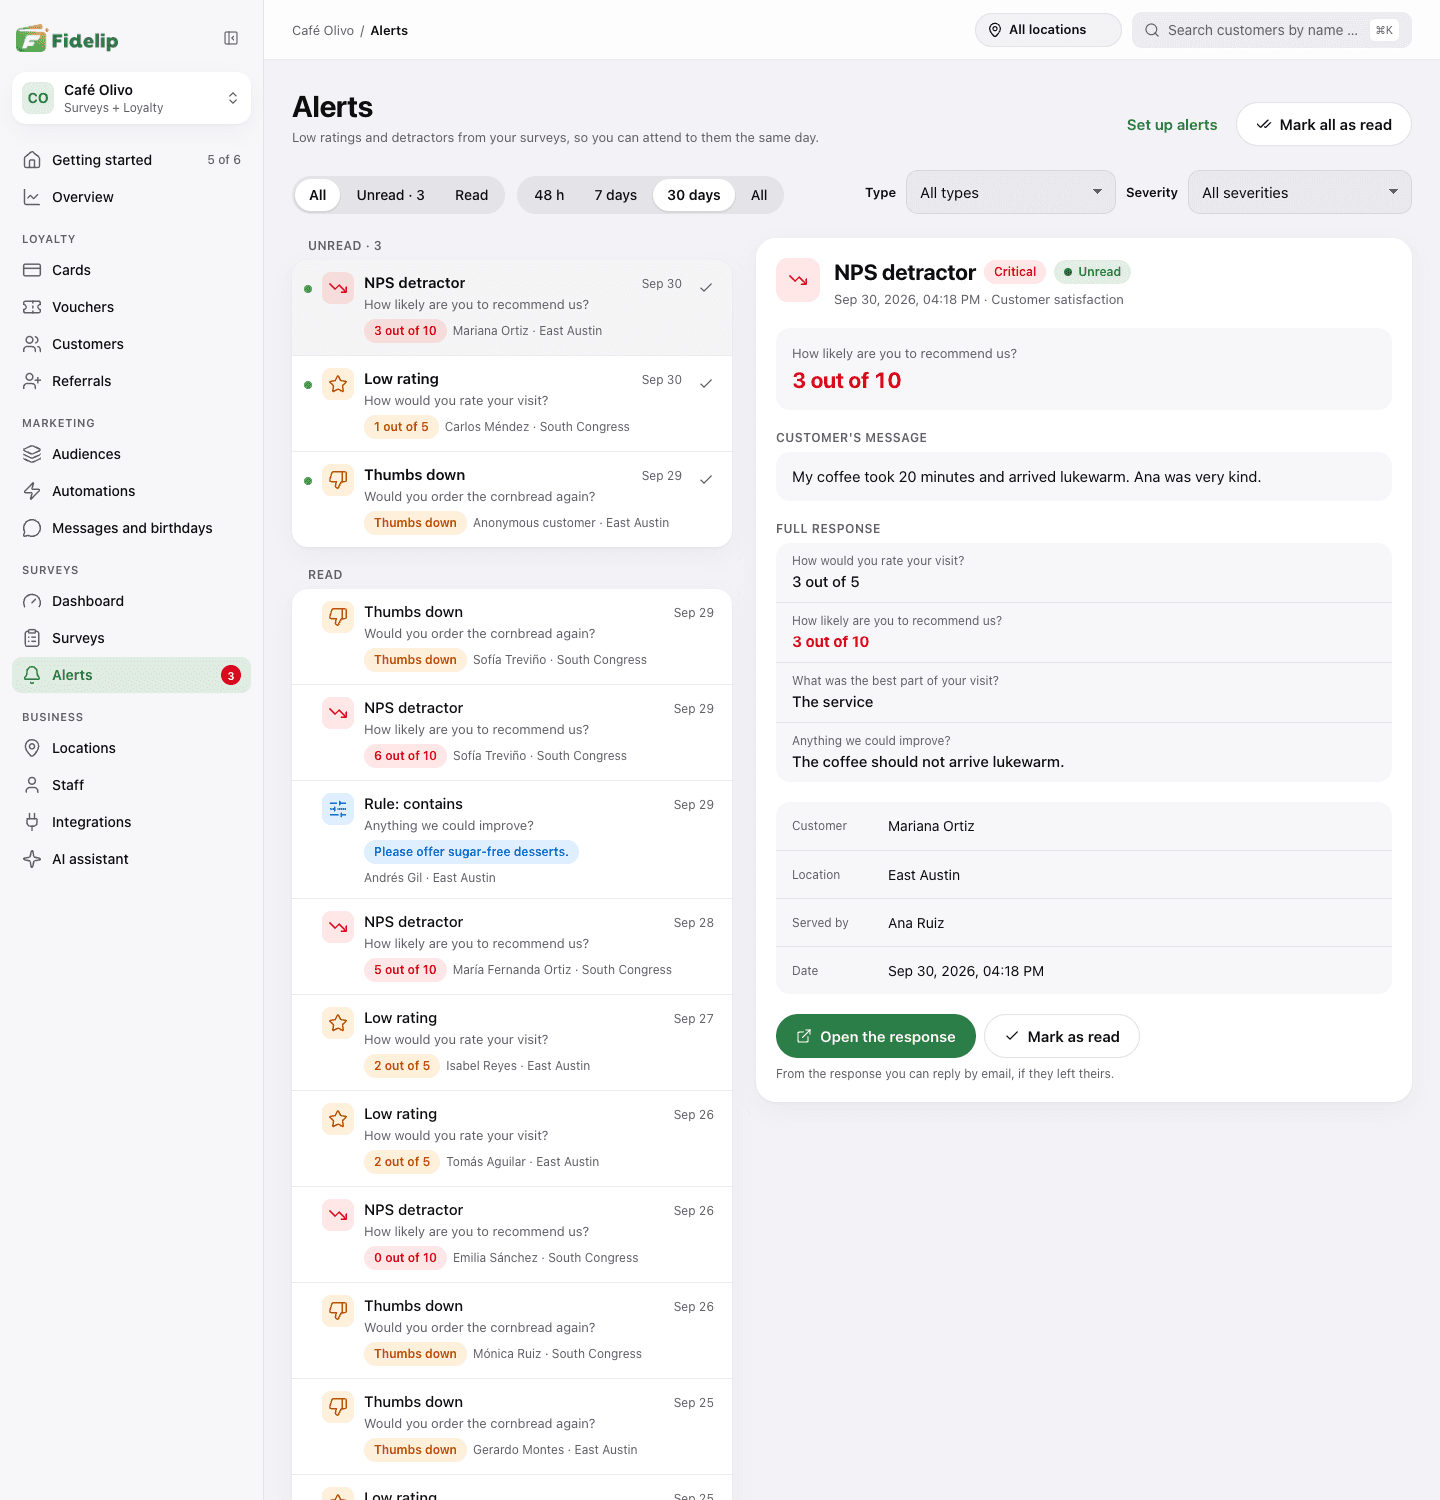
When a customer leaves a negative opinion, Fidelip automatically creates an alert. You see it in Dashboard → Surveys → Alerts (the red number in the menu counts the ones you have not read) and it is emailed to whoever you choose; Critical and Warning alerts also reach your team's Fidelip Staff app as a notification. With no setup, every survey creates automatic alerts for:
- Stars or faces at 2 or less (Warning).
- NPS detractor (a 0 to 6 on an NPS question), marked Critical.
- Thumbs down (Warning).
- A scale in its lowest 30 % (Warning).
Set up alerts opens the Alerts section of the survey editor, under Survey settings: there you turn off the Automatic alerts and add Your rules: another threshold, a chosen option or a comment that contains a word (for example “dirty”), each with its severity (Info is the mildest and does not ring on phones). You also choose who gets the email, in Emails that get the alert, and whether the team notification rings, with Push notification to the team. See Alert rules.
In Dashboard → Surveys → Alerts the unread ones come first and the one you pick opens on the right, with the Customer's message and the Full response (on a narrow screen it opens in a sheet). Opening it does not mark it as read: you do that with Mark as read, or with Mark all as read, which marks every pending alert of your business even if the filters hide some (if so, it warns you first). Open the response takes you to the full response, where you can reply by email if the customer left theirs.
Filter by All, Unread or Read; by period (48 h, 7 days, 30 days or All: it opens on 48 h, so for an older one pick a longer period); by Type; by Severity (Critical, Warning or Info); and, with several locations, by the location in the top bar.
Besides the dashboard and the counter app, the only outgoing channel is email: WhatsApp and SMS are not supported yet. If you need urgent alerts somewhere else, we recommend forwarding the emails to a Slack channel or a Telegram group with an inbox filter.
The most effective way to win back a detractor is to contact them within 24 hours. If your team cannot respond that fast, set up an automatic reply thanking them for the feedback (in Automatic emails, inside Survey settings; see Automatic emails by rating) while someone reaches out personally.